One of the first visualizations on the web, the SmartMoney
Map of the Market displayed live stock market data
for more than a decade, starting in 1998.
Related academic papers:
Visualizing the Stock Market, CHI 1999
Ordered and quantum treemaps: Making effective use of 2D space to display hierarchies, ACM Trans. Graphics, 2002
Ordered Treemap Layouts,
InfoVis 2001
A Note on Space-Filling Visualizations and Space-Filling Curves,
InfoVis 2005
Collaborators
Marc Frons
Joon Yu
Ben Shneiderman
Ben Bederson

Data humor: the Map was
mentioned on a Saturday
Night Live sketch in 2001.
|

I designed the Map of the Market while at SmartMoney.com. The goal was
to give a quick answer to the question, "what's happening in the market?"
 The Map used a variant of the "treemap" technique pioneered by Ben Shneiderman.
The screen is divided into rectangular tiles that represent publicly traded
companies. The area of a rectangle corresponds to the market capitalization
of the company, and the color tells you how the stock price has changed
since the previous market close. Unlike
a traditional treemap, however, the Map of the Market introduced a new algorithm
designed to create tiles that were close to square, making for a display
that is more legible and easier to interact with. (It turns out that several others,
including Jarke van Wijk, independently
invented similar algorithms around the same time.)
The Map used a variant of the "treemap" technique pioneered by Ben Shneiderman.
The screen is divided into rectangular tiles that represent publicly traded
companies. The area of a rectangle corresponds to the market capitalization
of the company, and the color tells you how the stock price has changed
since the previous market close. Unlike
a traditional treemap, however, the Map of the Market introduced a new algorithm
designed to create tiles that were close to square, making for a display
that is more legible and easier to interact with. (It turns out that several others,
including Jarke van Wijk, independently
invented similar algorithms around the same time.)
The Map of the Market quickly became one of the most trafficked sections of
the site, and spawned many imitators. Today treemaps are a standard tool
for visualizing financial data.
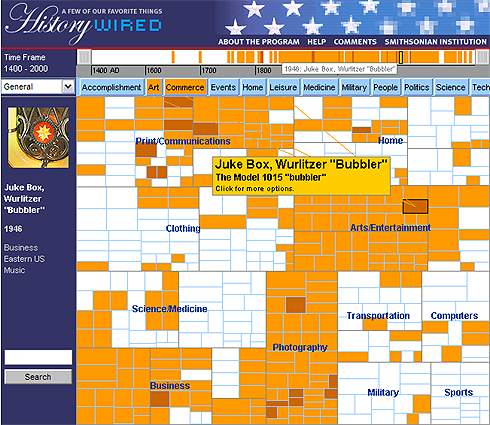
At SmartMoney we created many variations of this map. One of my favorites
the site History Wired,
a visualization of a selection of objects from the Smithsonian Museum. This was
built in collaboration with Judy Gradwohl at the Smithsonian.
|